car sales dashboard
See immediate improvements in decision-making, forecasting accuracy, and overall sales performance. The future of your sales success is just a dashboard away!
🔍 Key Features:
Real-time sales updates 🔄
Comprehensive sales pipeline analysis 📊
Customer segmentation for targeted strategies 🎯
Visualize trends with intuitive charts 📈
Drill-down capabilities for deeper insights 🔍
Dashboard overview:
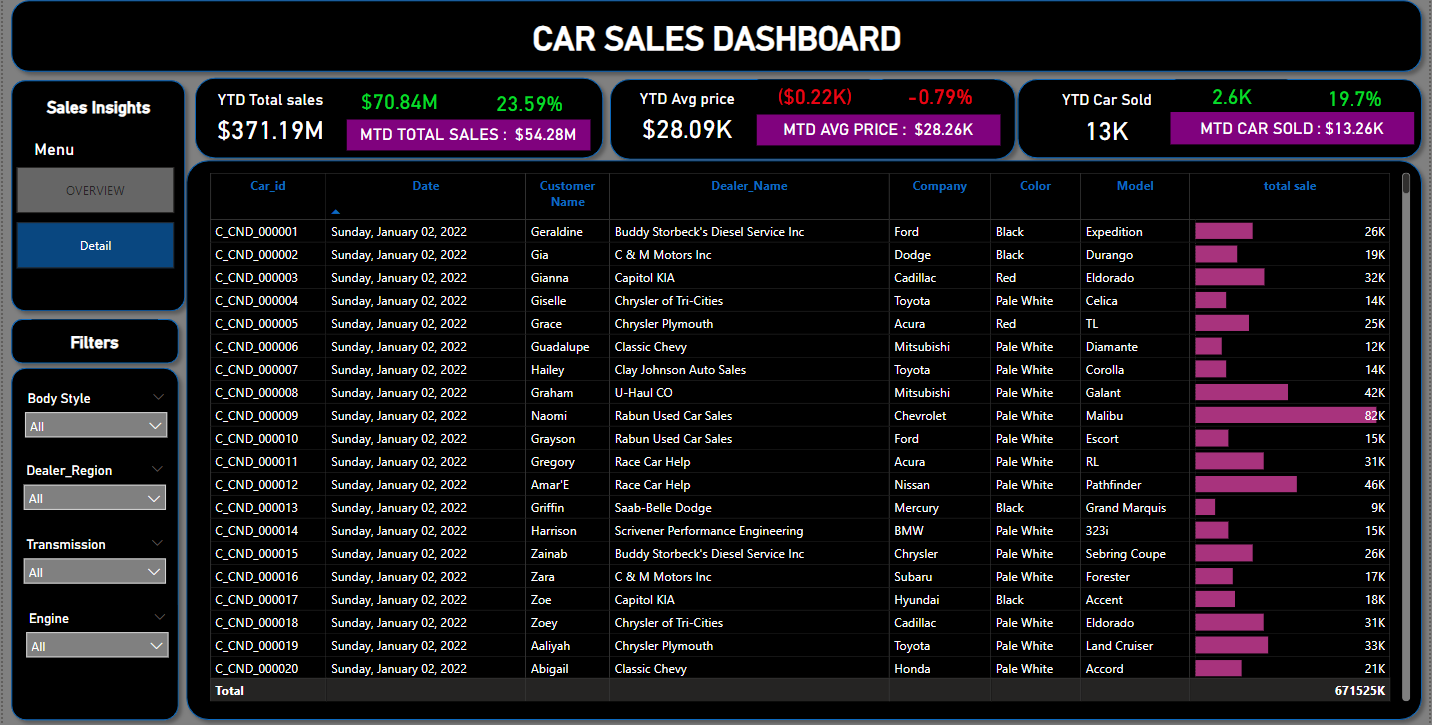
1. YTD sales weekly trend : Display line chart illustrating the weekly trend of ytd sales.
2.YTD total sales by body style : visualize the distribution of ytd total sales across different car body styles using a pie chart.
3.YTD total sales by color : Present the contribution of various car colors to the YTD total sales through a pie chart.
4.YTD total sales by dealer region : showcase the ytd sales data based on different dealer region using a map chart to visualize the sales distribution geographically.
5.comapny wise sales trend in grid form : provide a tabular grid that display the sales trend for each company.
6.Details grid showing all car sales information : create a detailed grid that present all relevant information for each car sales.![CAR SALES DASHBOARD
YTD Total sales $70 84M 23.59% RCT ($0 22K) -0.79% 1S ICN
$371.19M | MTD TOTAL SALES $5428M $28.09K [OEP ETE RES TETT [RETIRE RE PIS
A] YTO Total sates by Body Style YTO Total sales by Color
FRPIVIPNS BGT
fre
[ree
[rey
max point and total sale
$item ram
Company Wise Sales Trends
Err | FIRETY™Y
|r —) eT 3 pe rm neo sowie El 11s
[VNTR tenn ECE | [PANETT pr
Pret Corvraite
: Vo 1 fn BRYN [ERT Fre
hand ( ) Lin Brava | EYRE prt
CE o PIE. wr sewn EE
[ee ERE] [TET] rs
[yer ) r—— Po. Pa DOEETHII. pe](https://contents.bebee.com/users/id/7lZhS655c9b4522019/post/5LIOg65bdce991968d/ilNb8.png)

More posts from Ravichandran a
View posts
CUSTOMER SEGMENTATION (RFM) ANALYSIS - RETAIL DOMAIN
Ravichandran a · To Build a machine learning model that predicts whether an online customer of a retail shop will make their next purchase 90 days from the last purchaseTo Build a machine learning model that predicts whether an online customer of a retail shop will make their next purchase 90 day ...

LUNG CANCER PREDICTION -HEALTH CARE DOMAIN
Ravichandran a · We intend to develop a comprehensive predictive model for lung cancer risk assessment using a dataset enriched with a wide array of patients attributes, including gender,age, smoking history and spectrum of health related indicators. · PROJECT WOKRFLOW · Data wrangling · Data cle ...

Wine Quality Data Analysis
Ravichandran a · The focus is on predicting the quality of wine based on its chemical characteristics, offering a real-world application of machine learning in the context of viticulture. The dataset encompasses diverse chemical attributes, including density and acidity, which serve as the featur ...
You may be interested in these jobs
-
Drive Car Loan business (New & Used) in the assigned territory and achieve monthly disbursement and revenue targets as per business plan. · ...
Hyderabad3 weeks ago
-
+The chosen candidate will play a crucial role as H Promise Manager in the sales department by overseeing their dealership's daily used car operations and inventory. · Maintain accurate new and used vehicle information on internet by taking and submitting vehicle photographs and ...
Chandigarh, Chandigarh1 month ago
-
I'm looking for a skilled photographer to take high-quality pictures of my car for a sales listing. · ...
2 weeks ago


Comments