

Retail sales analytics dashboard
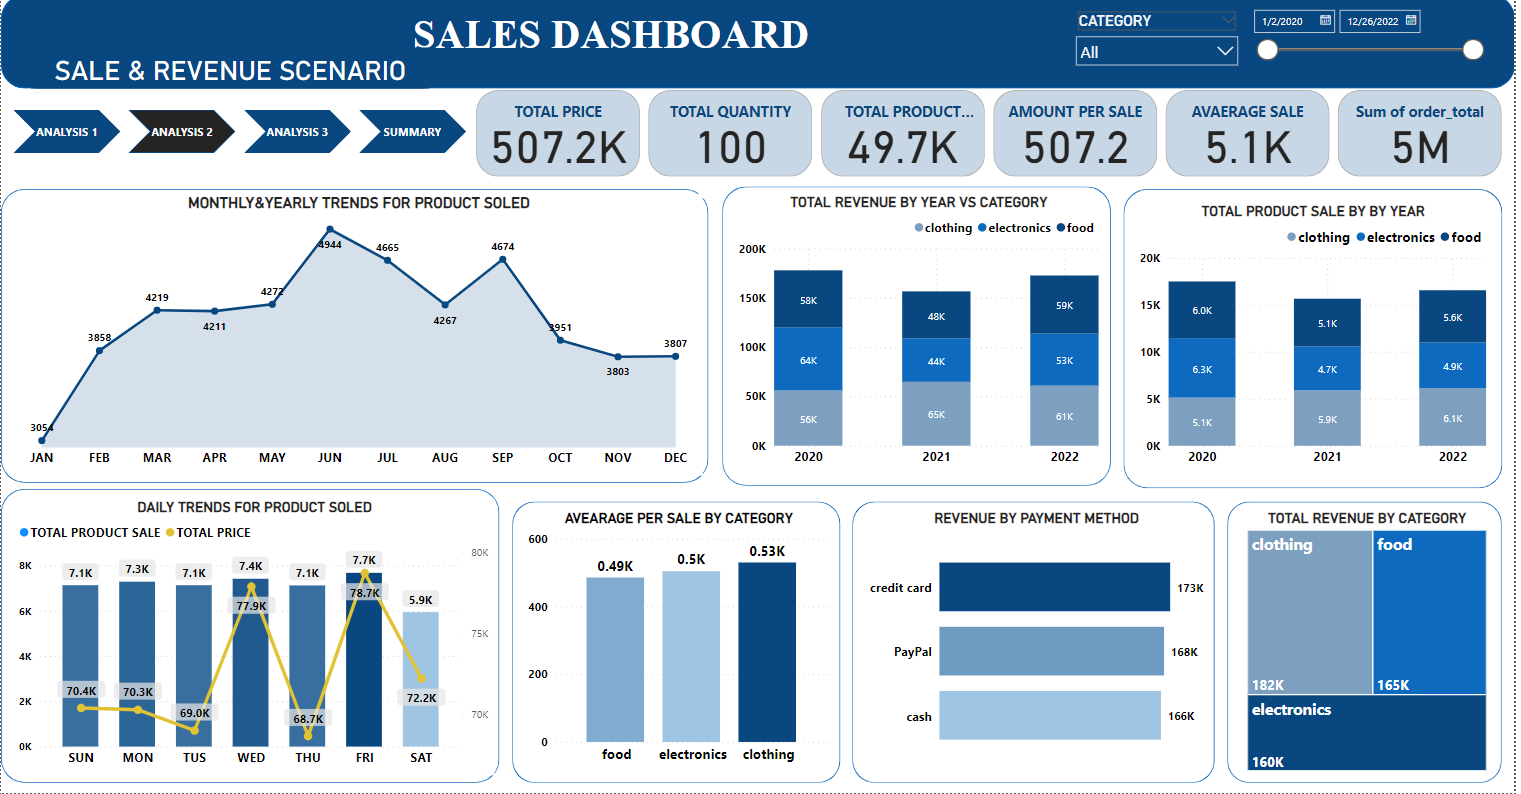
This project aims to create an analytics dashboard for
retail businesses to analyze sales trends, customer behavior,
and store performance.
The dataset includes sales data, customer profiles,
and store information. Preprocessing involves aggregating
sales data, calculating customer metrics. Visualizations can reveal insights into customer demographics, popular products, and peak shopping hours, enabling retailers to optimize inventory, plan marketing campaigns, and enhance customer experiences.
@Bostoninstituteofanalytics![SALES DASHBOARD CATEGORY
AR
PRODUCT TREND ANALYSIS
= = = = TOTAL PRICE TOTAL QUANTITY TOTAL PRODUCT. AMOUNT PER SALE AVAERAGE SALE Sum of order total
507.2K 100 497K 507.2 51K 5M
DAILY TRENDS FOR TOTAL ORDER VS PRICES MONTHLY TRENDS FOR TOTAL ORDERS TOTAL ORDER BY COUNTRY
®ctothing
om onm
069M al on 069M
I oem REA
704K = 1 1] =n
HE me
" JAN HIE MAR APR MAY JUN JUL AUG SIF OCT NOV DEC Pome Ton © £5 ht Cpr, § Aire
% OF TOTAL ORDER BY GENDER TOTAL ORDER BY YEAR VS CATEGORY TOTAL ORDER BY CATEGORY ORDER STATUS BY CATEGORY
© clothing ® rirctions ®lood © clothing ® electronics ©1000
01m Customer gender 2om
01M (2%) 2% IM gpa
® fugendes
© Agender rcteancs
om v om
2m © Non binary
(44%)
oom oom
nro 7071 027 ‘ pending Gelvered shipped](https://contents.bebee.com/users/id/7lZhS655c9b4522019/post/gfUZk65bdd03ecb008/X9OeA.png)
![SALES DASHBOARD
PERFORMANCE SUMMARY
WEEKLY TRENDS;
AT 768602 WED had highest order and 17% higher than
Tuesday
At 7681 Friday had the highest product soled and was
29.22% higher than Saturday.
The total order and total revenue are positively correlated
each other.
MONTHLY TREND:
JUN had the highest order and 49.99% higher than
December.
At 4944, JUN had the highest product sale and was
61.89% higher than JAN, which had lowest product sale
213054.
Clothing had the highest order(1751262)/product sale
(17201) and compare to food(1654507) and
electronics(1582371).
Male accounted for 45.79% total order.
The credit card payment method are use highly.
At CHINA had the highest revenue contribute to store.
= 2020 177928
@1 48394
22 46453
a3 39128
clothing 8634
electronics 16879
food 1161
@4 43953
= 2021 156566
@1 37817
22 33637
®3 42392
4 42720
= 2022 172668
oR] 40820
®2 48818
23 46864
4 36166
io BE 2AL>]
17499
3996
4692
3976
OTAL PRICE TOTAL PRODUCT SALE TOTAL QUANTITY AVAERAGE SALE AMOUNT PER SALE Sum of order total
97 1.834.31
55 879.89
60 774.22
54 724.59
0) 482.03
) 244 60
56 784.88
93 1,683.51
54 700.31
42 800.88
61 694.95
53 806.04
97 1,780.08
55 742.18
65 751.05
54 867.85
51 709.14
pL 5,071.62
514.24
556.25
516.14
483.06
499.47
511.65
511.04
509.65
481.73
547.69
496.17
510.25
478.61
503.91
1689330
391480
448368
447311
186204
402171
1519717
377625
372561
393362
376169
1779093
418356
527881
488401
344455
REE](https://contents.bebee.com/users/id/7lZhS655c9b4522019/post/gfUZk65bdd03ecb008/fJ4MO.png)
![SALES DASHBOARD
PRODUCT&CUSTOMER PERFORMANCE
TOP § COUTRY BY REVENUE
ne. I
woe, I
Sass 34K
Pagan 12K
Bean 26K
[3 sox 100K
© clothing ® rirctronscs ®lood
TOP § REVENUE BY CITY.
204
17%
Pep 17%
Menon 14K
LOWEST REVENUE BY CITY
—
Seromrst
Morse 3
TOP § PRODUCT BY ORDER
name
24%
(unen be 19%
Biber ™
Cartoon [
TOP § PRODUCT BY HIGHEST SEALE
m
Chevess ton 270
262
249
Bian wm
TOTAL PRICE
TOTAL PRODUCT SALE
TOTAL QUANTITY
LOWEST PRICEAGUNATITY BY CUSTOMER
onmaor | 2
[r— 6
re I
rem [ o
[|]
a](https://contents.bebee.com/users/id/7lZhS655c9b4522019/post/gfUZk65bdd03ecb008/kkp9y.png)
More posts from Ravichandran a
View posts
CUSTOMER SEGMENTATION (RFM) ANALYSIS - RETAIL DOMAIN
Ravichandran a · To Build a machine learning model that predicts whether an online customer of a retail shop will make their next purchase 90 days from the last purchaseTo Build a machine learning model that predicts whether an online customer of a retail shop will make their next purchase 90 day ...

LUNG CANCER PREDICTION -HEALTH CARE DOMAIN
Ravichandran a · We intend to develop a comprehensive predictive model for lung cancer risk assessment using a dataset enriched with a wide array of patients attributes, including gender,age, smoking history and spectrum of health related indicators. · PROJECT WOKRFLOW · Data wrangling · Data cle ...

Agricultural crop production Data analysis in python
Ravichandran a · Data-Analysis-in-Python/crop production analysis at main · ravichandranECE/Data-Analysis-in-Python · Contribute to ravichandranECE/Data-Analysis-in-Python development by creating an account on GitHub. · https://github.com/ravichandranECE/Data-Analysis-in-Python/tree/main/crop%20 ...
You may be interested in these jobs
-
This is an executive position for the jewelry industry in Bangalore. The role involves preparing MIS reports daily/weekly/monthly on sales and other metrics. · MIS/Data Reporting (retail/luxury preferred) · Excel expert (pivot, VLOOKUP, formulas) · ...
Bengaluru2 weeks ago
-
This Sales Operations role serves as the analytical backbone for PepsiCo Foods and Beverages e-commerce operations across India's high-growth quick-commerce and online retail channels. · ...
Hyderabad, Telangana3 weeks ago
-
A Senior Engineer — CRM Analyst is responsible for designing building and operating Salesforce CRM Analytics artifacts—Dataflows/Recipes Datasets Lenses and Dashboards—to deliver scalable high-performance sales and finance analytics. · ...
Pune1 day ago
Comments